NDVI Averaging to Distinguish Kelp Beds
For my remote sensing graduate class, I performed a project quantifying kelp that had washed ashore on the beach. We were required to give a presentation to the class at the end of the semester and I wanted to create a map of the study area, Asilomar State Beach on the Monterey Peninsula, showing the offshore kelp forests from where the kelp is transported onto the beach. Through the project, I got access to Planet imagery through their Education and Research Standard license. Through Planet, I had access to near-daily four band (green, blue, red, and near-infrared) imagery with 3-meter resolution. I created a Python script to calculate NDVI for any Planet image just by inputting the file path and file name. When I calculated the normalized difference vegetation index (NDVI) for one of the scenes, I was greeted with lots of grain for the ocean, making it very difficult to distinguish kelp, see figure below.
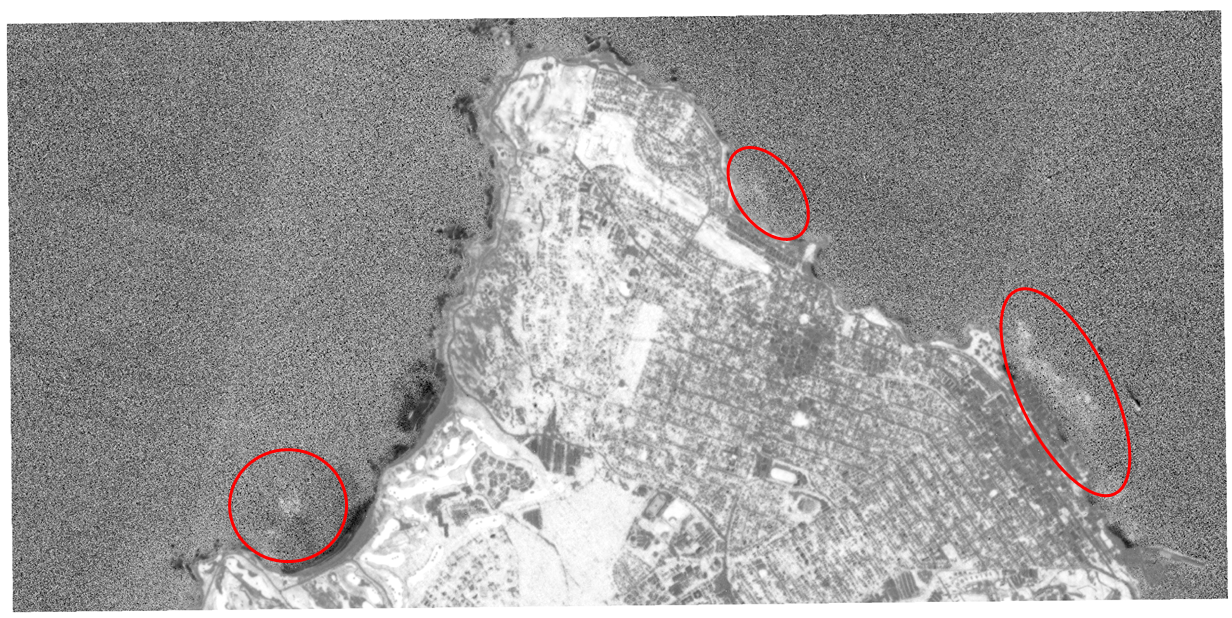
To clean up the image, I decided to try averaging multiple NDVI images together taken across multiple days. I accomplished this by reading the data into Python using the rioxarray and then performing simple averaging across the specified images to create an averaged NDVI iamge. I downloaded seven scenes in total from February 1st through 13th, and then calculated the average for three, five, and seven days. I wanted to see which range would produce the best result by reducing the amount of noise in the ocean. For the three-day average, I created two separate averages by using three days in sequence (i.e. February 1st, 2nd, and 3rd) and three days separated by about a week (i.e. February 1st, 7th, and 13th). I wanted to see if having additional days with varying wave conditions might help too. Below are the results:
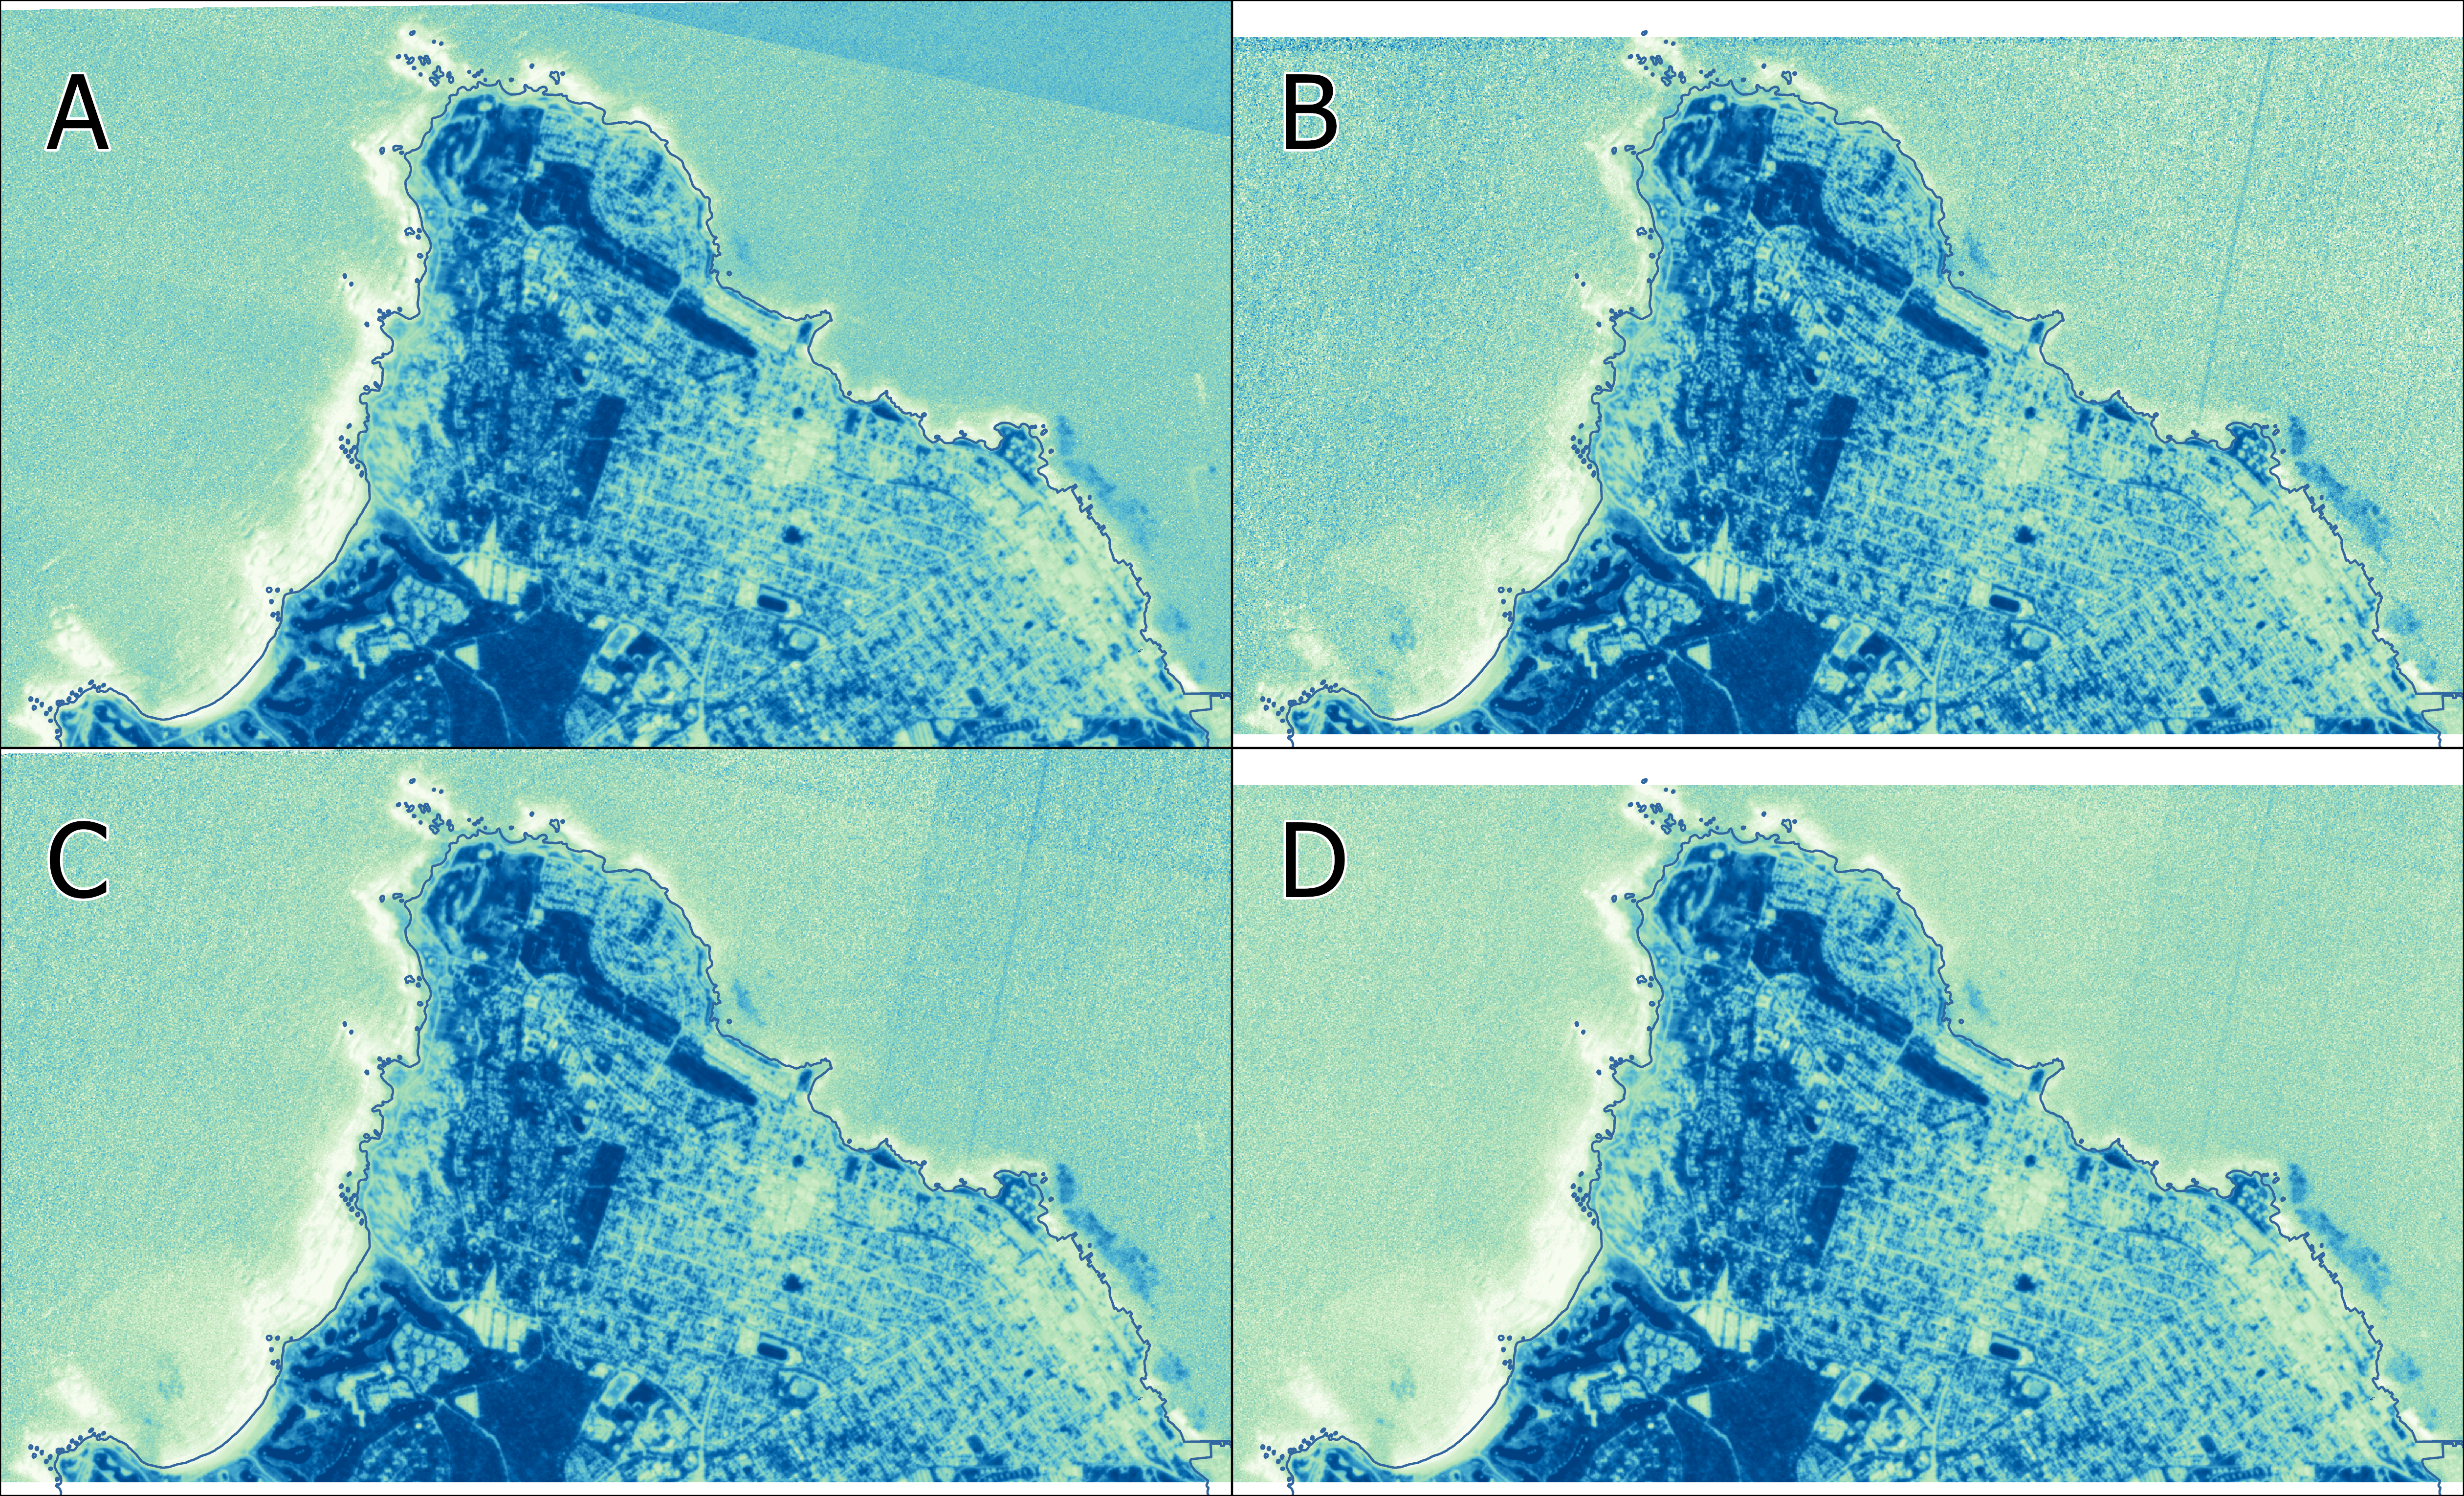
From the different images, the three-day averaged with consecutive days was able to detect some of the kelp beds, but not by much (especially the area in the lower left corner). The three days but with a week between each image was better at detecting the kelp but did have a greater amount of noise in the ocean. The five- and seven-day averages were similar, but the seven-day average did have the least amount of grain/noise as indicated by the ocean being a similar yellow color with less blue. I would probably recommend the five-day average as the best for distinguishing the differences, but the three-day average with a week between them would also work for kelp bed detection.
In the future, I would like to continue on this project by training an image classification model to identify the areas with kelp and use that output to create a shapefile of the kelp beds. A similar process is already being done by the California Department of Fish and Wildlife along with other reserach groups, but the data isn't always readily available/the most up to date. Below is a link to the GitHub repository with the functions/code for this project: