Zero-Inflated Poisson Models on Surf Zone Assemblage
I wanted to investigate the effect of environmental variables on the surf zone species I was observing on the baited remote underwater video stations (BRUVS). To do this, I chose to perform a zero-inflated Poisson model for each species and all the environmental variables recorded on the day the video was collected. Poisson models assume the data follows a Poisson distribution of positive count data that is highly skewed. I used the MaxN metric as a proxy for abundance on my data. MaxN represents the maximum number of individuals of the same species observed in a single frame of video and is more accurate for abundance data in video because it prevents the same individual from dropping out of frame and re-entering resulting in inflated estimates. In a regular Poisson model, the probability of observing a zero is only 0.67%, but in the surf zone, it is common for a given species to be absent on many BRUVS. Therefore, I chose to perform the zero-inflated Poisson model which accounts for an excess of zeroes. First, I plotted the MaxN value for each species to observe the distribution.
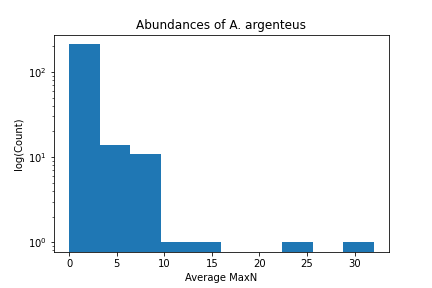
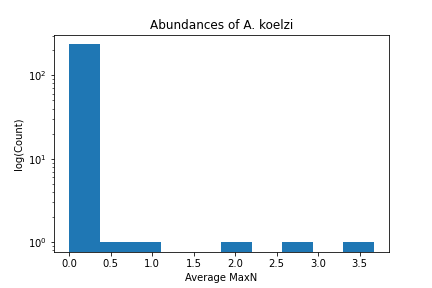
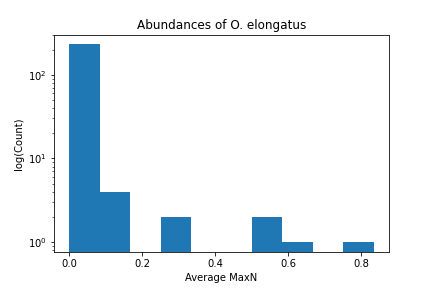
The abundances for the species were heavily skewed to the left, or towards zero, so the zero-inflated model appeared best. The environmental factors I was assessing for each species included: tide height during sampling, wind speed, depth of BRUVS, water visibility of BRUVS, water temperature, wave height, and wave period. I observed 17 species on the BRUVS and compared the abundances of each species individually to all environmental factors. I created a script in Python to run the model using the ZeroInflatedPoisson() function from the "statsmodel" package with the inputs as a matrix of the abundance data for the species and another matrix of all the environmental variables. I then iterated the model through each species and interpreted the results, as seen below.
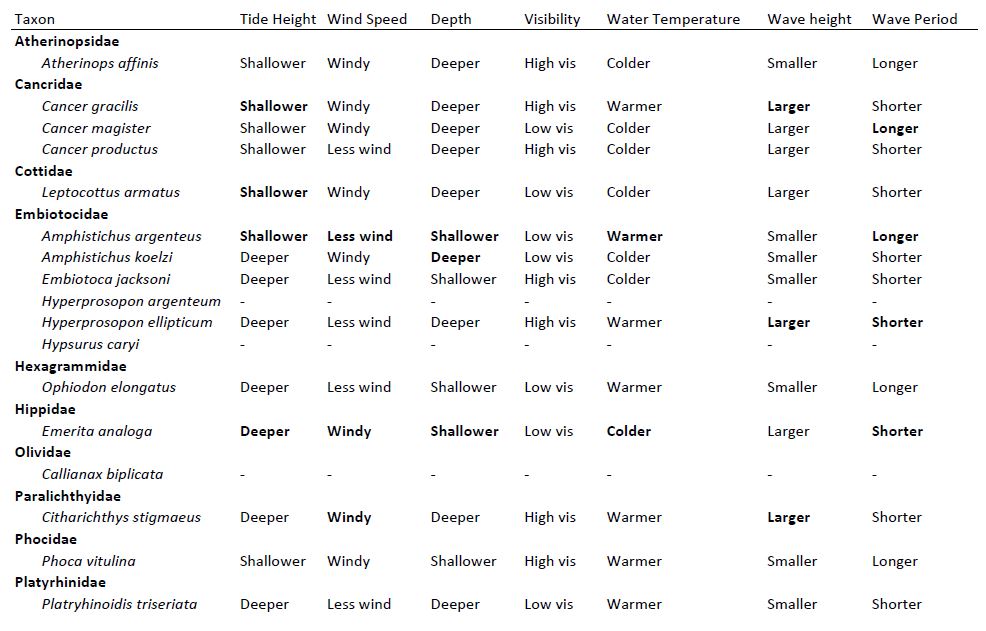
Overall, I was able to run the model for 14 of the 17 species, and the model didn't fit well with all the species. This was more of a preliminary project investigating question 3 of my thesis, which environmental factors drive the differences in surf zone assemblage. Since then, I've added in additional variables like salinity and the percent cover of different algae species and switched to a distance-based redundancy analysis. The results from that analysis are available under the surf zone page in the research tab, but the button below will take you to the GitHub repository with the code I used to perform the zero-inflated Poisson models. I'm still, actively analyzing this data as part of my master's thesis, so it's not publicly available yet. But if you're interested in using the data, please reach out to me as gammonkoval@csumb.edu and we can discuss from there.